

9.80%
Compounded Net Yield For 2023
Mortgage investments are not guaranteed, returns may fluctuate, and past performance may not be repeated.
Inquiries: investor.info@westboromic.com
9.00%
Monthly Non-Compounded Annualized Yield for March
Mortgage investments are not guaranteed, returns may fluctuate, and past performance may not be repeated.
Inquiries: investor.info@westboromic.com
The Fund: See Below For The Monthly Net Return (%)
| Year | Jan | Feb | Mar | Apr | May | Jun | Jul | Aug | Sep | Oct | Nov | Dec | Bonus ˄ | Total | Compounded Yield | |
|---|---|---|---|---|---|---|---|---|---|---|---|---|---|---|---|---|
| 2004 | 0.67% | 0.67% | 0.67% | 0.67% | 0.67% | 0.67% | 0.67% | 0.00% | 4.69% | |||||||
| 2005 | 0.67% | 0.67% | 0.67% | 0.67% | 0.67% | 0.67% | 0.67% | 0.67% | 0.67% | 0.67% | 0.67% | 0.67% | 2.36% | 10.40% | 10.8% | |
| 2006 | 0.67% | 0.67% | 0.67% | 0.67% | 0.67% | 0.67% | 0.67% | 0.67% | 0.67% | 0.67% | 0.67% | 0.67% | 2.35% | 10.39% | 10.8% | |
| 2007 | 0.67% | 0.67% | 0.67% | 0.67% | 0.67% | 0.67% | 0.67% | 0.67% | 0.67% | 0.67% | 0.67% | 0.67% | 2.08% | 10.12% | 10.5% | |
| 2008 | 0.67% | 0.67% | 0.67% | 0.67% | 0.67% | 0.67% | 0.67% | 0.67% | 0.67% | 0.67% | 0.67% | 0.67% | 1.74% | 9.78% | 10.2% | |
| 2009 | 0.67% | 0.67% | 0.67% | 0.67% | 0.67% | 0.67% | 0.67% | 0.67% | 0.67% | 0.67% | 0.67% | 0.67% | 1.90% | 9.94% | 10.3% | |
| 2010 | 0.67% | 0.67% | 0.67% | 0.67% | 0.67% | 0.67% | 0.67% | 0.67% | 0.67% | 0.67% | 0.67% | 0.67% | 1.30% | 9.34% | 9.7% | |
| 2011 | 0.67% | 0.67% | 0.67% | 0.67% | 0.67% | 0.67% | 0.67% | 0.67% | 0.67% | 0.67% | 0.67% | 0.67% | 1.10% | 9.14% | 9.5% | |
| 2012 | 0.67% | 0.67% | 0.67% | 0.67% | 0.67% | 0.67% | 0.67% | 0.67% | 0.67% | 0.67% | 0.67% | 0.67% | 0.79% | 8.83% | 9.2% | |
| 2013 | 0.67% | 0.67% | 0.67% | 0.67% | 0.67% | 0.67% | 0.67% | 0.67% | 0.58% | 0.58% | 0.58% | 0.58% | 0.00% | 7.68% | 7.9% | |
| 2014 | 0.58% | 0.58% | 0.58% | 0.58% | 0.58% | 0.58% | 0.58% | 0.58% | 0.58% | 0.58% | 0.58% | 0.58% | 0.10% | 7.06% | 7.3% | |
| 2015 | 0.58% | 0.58% | 0.58% | 0.58% | 0.58% | 0.58% | 0.58% | 0.58% | 0.58% | 0.58% | 0.58% | 0.58% | 0.44% | 7.40% | 7.7% | |
| 2016 | 0.58% | 0.58% | 0.58% | 0.58% | 0.58% | 0.58% | 0.58% | 0.58% | 0.54% | 0.54% | 0.54% | 0.54% | 0.00% | 6.80% | 7.1% | |
| 2017 | 0.54% | 0.54% | 0.54% | 0.54% | 0.54% | 0.54% | 0.54% | 0.54% | 0.54% | 0.54% | 0.54% | 0.54% | 0.00% | 6.48% | 6.7% | |
| 2018 | 0.54% | 0.54% | 0.54% | 0.50% | 0.50% | 0.54% | 0.54% | 0.54% | 0.54% | 0.54% | 0.54% | 0.54% | 0.00% | 6.40% | 6.6% | |
| 2019 | 0.54% | 0.54% | 0.50% | 0.50% | 0.50% | 0.54% | 0.54% | 0.54% | 0.54% | 0.54% | 0.54% | 0.54% | 0.00% | 6.36% | 6.6% | |
| 2020 | 0.54% | 0.54% | 0.54% | 0.54% | 0.54% | 0.54% | 0.50% | 0.50% | 0.50% | 0.50% | 0.50% | 0.50% | 0.00% | 6.24% | 6.4% | |
| 2021 | 0.50% | 0.50% | 0.44% | 0.44% | 0.44% | 0.46% | 0.46% | 0.48% | 0.50% | 0.50% | 0.50% | 0.63% | 0.65% | 6.50% | 6.7% | |
| 2022 | 0.50% | 0.52% | 0.52% | 0.52% | 0.60% | 0.64% | 0.66% | 0.66% | 0.67% | 0.70% | 0.70% | 0.70% | 0.00% | 7.39% | 7.7% | |
| 2023 | 0.70% | 0.70% | 0.70% | 0.70% | 0.70% | 0.73% | 0.73% | 0.73% | 0.75% | 0.75% | 0.80% | 0.80% | 0.59% | 9.38% | 9.8% | |
| 2024 | 0.75% | 0.75% | 0.75% |
^Year end top-up distributions are typically paid post year-end audit.
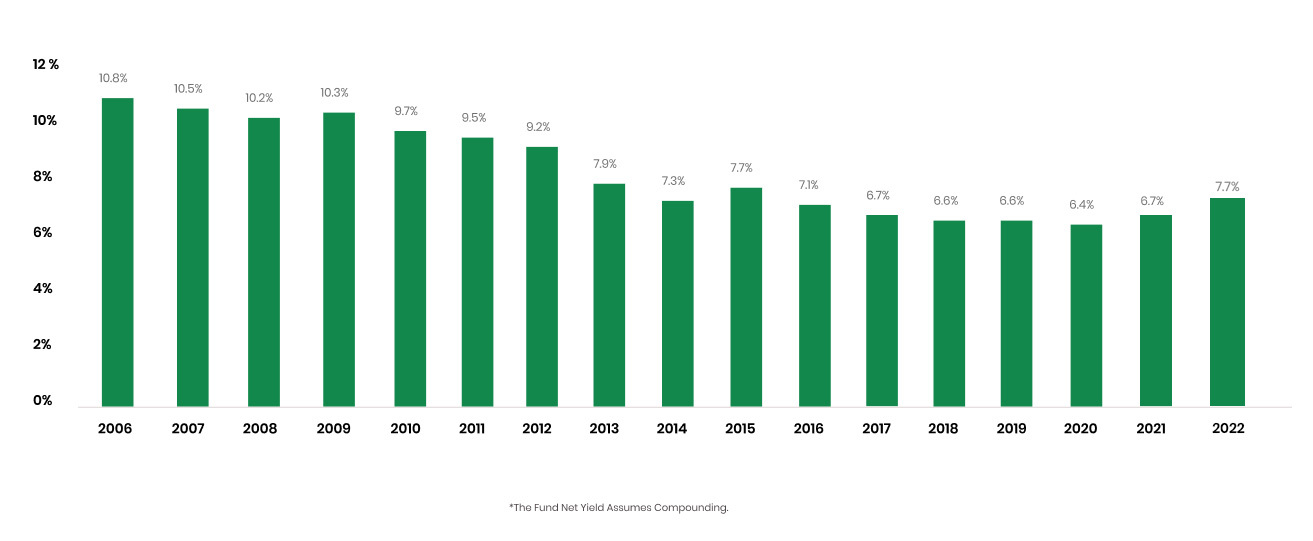
Historical Performance – Annual Net Yield*:
This does not represent an offering of securities. The securities described herein are only available to Accredited Investors in Canada through registered dealers in accordance with applicable securities laws. The information disclosed in this summary is incomplete.
Westboro Mortgage Investment LP, Westboro Mortgage Investment Trust, and Westboro Mortgage Investment Corp. (the “Fund”) objective is to generate consistent and above average risk-adjusted returns to investors with stable and secure distributions from its investment in mortgages through a professionally managed mortgage portfolio of short duration, single family residential and commercial mortgages on real property, located primarily in Eastern and Southern Ontario with a focus on the Ottawa Valley and surrounding urban centers.